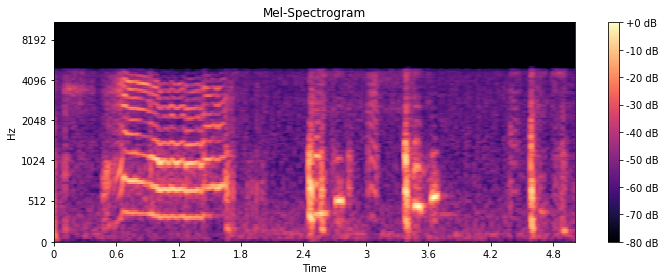
The Mel Spectogram is a 3D representation of the sound. It has the time in abscissa axis, the frequency in Hz on the orderly axis and the third dimension the volume in dB, represented with a color spectrum from black (-∞ dB) to yellow/white (+0 dB).
This representation is widely used for sound classification by applying image recognition patterns with machine-learning and deep-learning algorithms.
Going further :